
ASIAN AMERICANS
TOPICSDATAREPORTSGOVERNMENT 10-KCLIMATE
AAPI Demographics: Data on Asian American ethnicities, geography, income, and education
From Indian Americans to Laotian Americans, demographics across Asian ethnicities reveal differences in everything from educational attainment to family size.
Published on Mon, May 17, 2021 9:53AM PDT | Updated Mon, May 1, 2023 4:04PM PDT
There are 23.5 million Asian Americans living in the US, making up 7.1% of the US population. Among them, 3.8 million identify as Asian in combination with another race.
Asian Americans are sometimes grouped with Pacific Islanders under the “AAPI” umbrella, and the joint Asian American and Pacific Islander heritage month is celebrated annually in May. The AAPI population is the fastest growing racial group in the US, with a population that increased 27% from 2011 to 2021.
The demographics of Asian Americans vary drastically across ethnic groups. Taiwanese and Indian Americans have the highest educational and income outcomes, while Southeast Asian Americans have lower incomes and educational attainment.
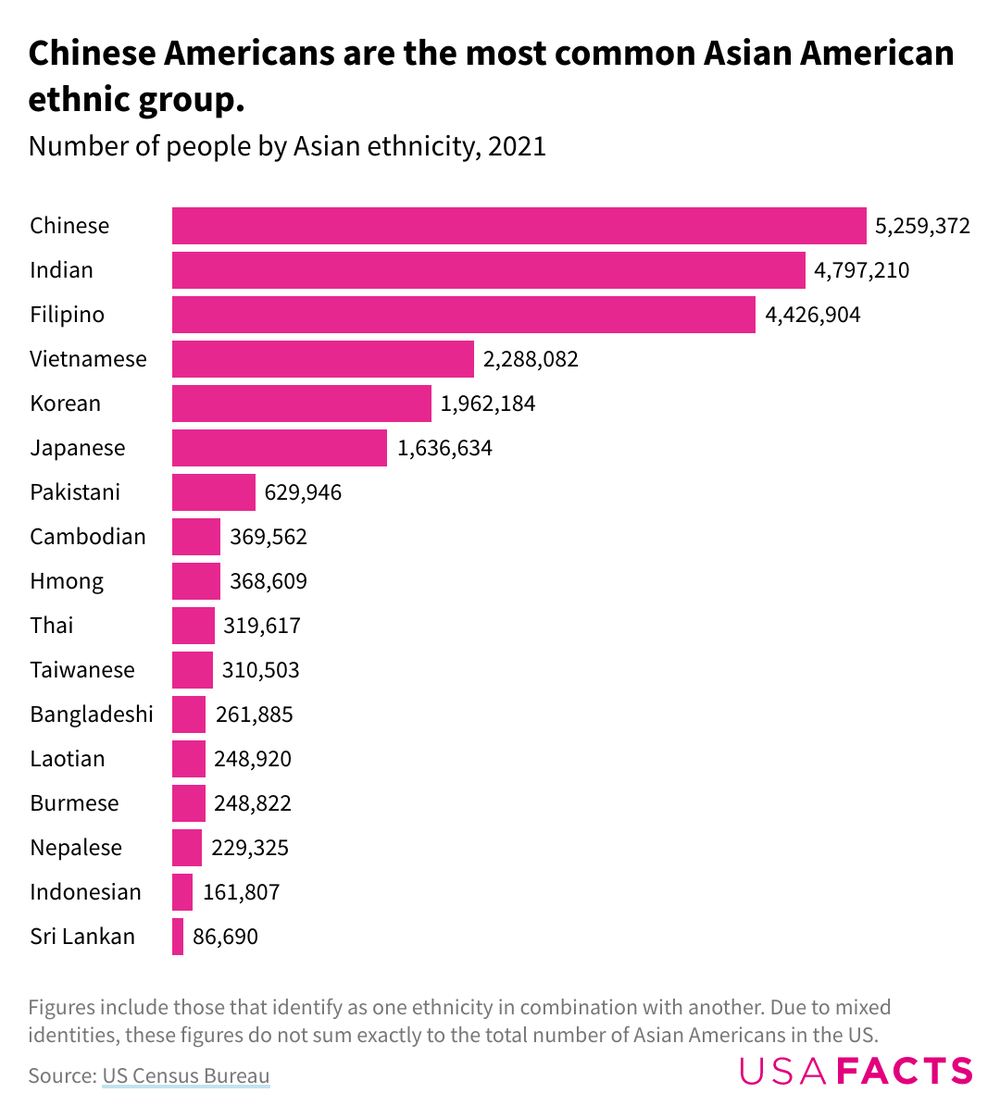
Which are the largest Asian American ethnic groups in the United States?
Six Asian ethnicities have a US population exceeding 1 million. With 5.3 million people, Chinese Americans are the largest group, representing 22% of the Asian American population. The next largest groups are Indian Americans (20% of all Asian Americans), Filipino Americans (16%), Vietnamese Americans (10%), Korean Americans (8%), and Japanese Americans (7%).
Which states have the highest Asian American populations?
Three states account for 46% of the Asian American population: California, New York, and Texas. The states with the largest share of Asian Americans are Hawaii (57%), California (18%), and Washington (12%).
Over half of Hawaiians identify as Asian-American.
Percentage of each state that identifies as Asian, 20211.256.5Figures include those that identify as Asian alone or in combination with another race.Source: US Census BureauGet the dataDownload imageDownload SVGEMBED ON YOUR WEBSITECopy
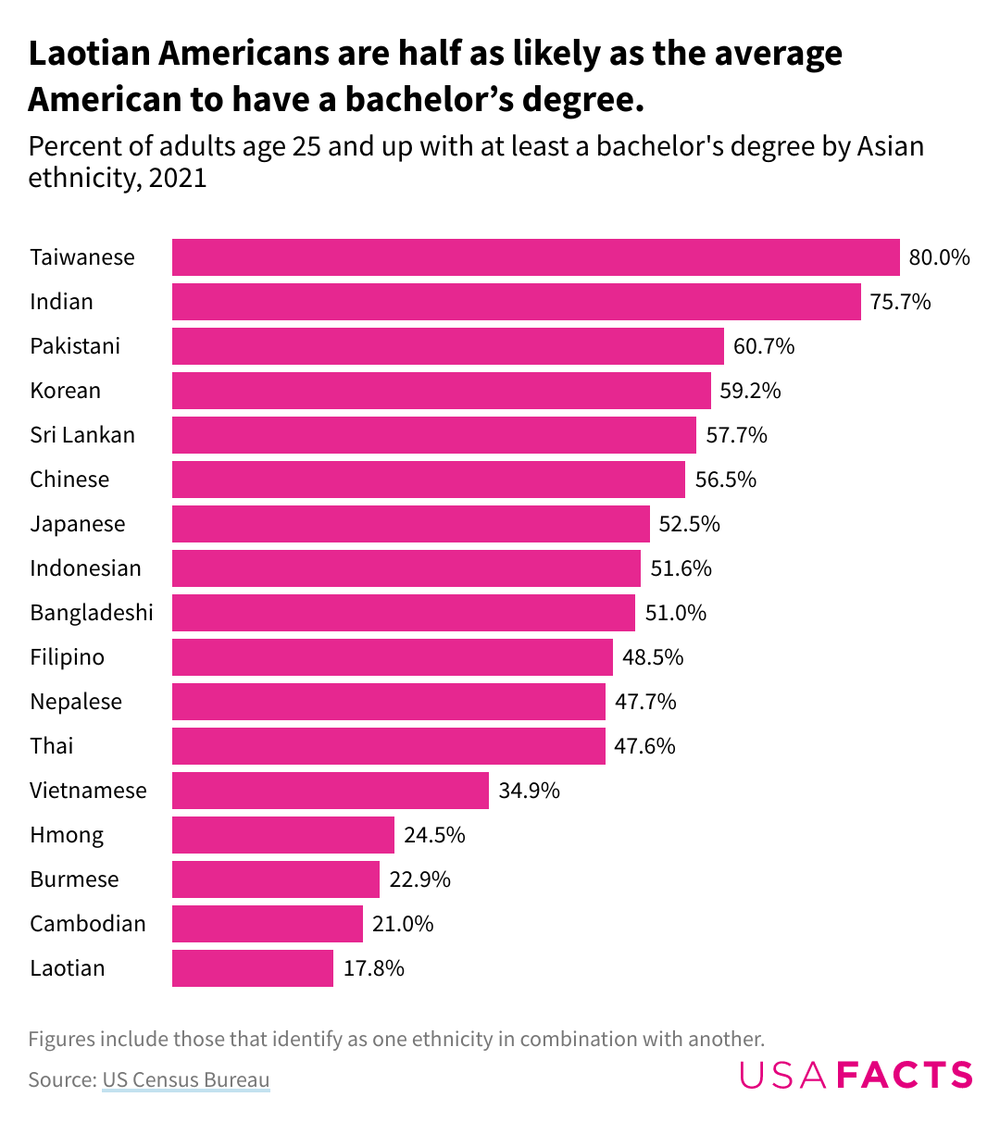
How do Asian Americans’ education levels and income differ by ethnicity?
Fifty-five percent of Asian Americans over age 25 have a bachelor’s degree, compared with 35% of the total population. About 80% of Taiwanese Americans have a bachelor’s, the highest of any Asian ethnicity. At 76%, Indian Americans make up the next highest percentage. Laotian Americans have the lowest educational attainment among Asian ethnicities.
The median household income for Asian American households is $97,626 a year, 40% higher than the US median of $69,717. Two Asian American ethnic groups have median household income above $100,000: the median for Indian American households is $138,418, and the median for Taiwanese American households is $117,652.
Indian Americans bring in twice the income of the average American.
Median household income by Asian ethnicity, 2021Indian$138,418Taiwanese$117,652Filipino$96,883Pakistani$95,747Sri Lankan$94,034Chinese$91,881Japanese$90,566Indonesian$86,751Korean$83,354Hmong$80,175Vietnamese$78,845Thai$78,434Nepalese$78,043Laotian$76,962Cambodian$75,424Bangladeshi$66,641Burmese$62,352Figures include those that identify as one ethnicity in combination with another.Source: US Census BureauGet the dataDownload imageDownload SVGEMBED ON YOUR WEBSITECopy
How do Asian-American family structures differ by ethnicity?
Asian-Americans tend to be more family-based than the average US household. Seventy-one percent of Asian households are made up of families — instead of people living alone or with unrelated people — compared with 65% of all households.
With an average of 3.4 people, Asian American families are also larger than the average of all US families at 3.2.
The average Hmong, Burmese, Pakistani, or Bangladeshi American family in the US all have more than four members. Korean and Japanese American families are the smallest among all groups, with an average size of 3.1.
Among Asian ethnicities, Hmong American families tend to be the largest.
Average family size by Asian ethnicity, 2021Hmong4.65Burmese4.28Bangladeshi4.1Pakistani4.09Cambodian3.85Laotian3.65Nepalese3.64Vietnamese3.57Filipino3.52Any Asian American3.4Asian Indian3.35Sri Lankan3.35Chinese (except Taiwanese)3.21Thai3.16Overall population3.15Indonesian3.15Taiwanese3.1Japanese3.05Korean3.05Figures include those that identify as Asian in combination with another racial group.Source: Census Bureau Get the dataDownload imageDownload SVGEMBED ON YOUR WEBSITECopy
How does the government define Asian American, and where does the data come from?
In 1997, the Office of Management and Budget (OMB) outlined the current standards for federal data on race and ethnicity that separated the “Asian or Pacific Islander” category into “Asian” and “Native Hawaiian or Other Pacific Islander.”
The Census Bureau, in accordance with this, defines an Asian person as “a person having origins in any of the original peoples of the Far East, Southeast Asia, or the Indian subcontinent including, for example, Cambodia, China, India, Japan, Korea, Malaysia, Pakistan, the Philippine Islands, Thailand, and Vietnam.”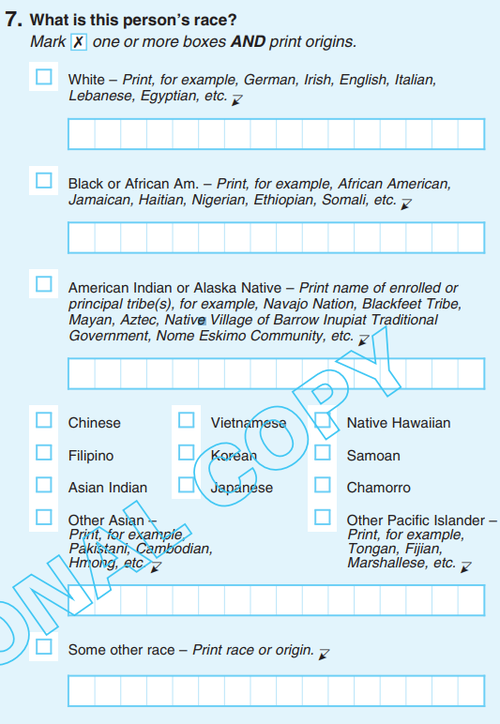 A sample Census form
The agency has never had a checkbox for “Asian” or “Asian American” in its official census forms. In the 2020 census form, there were checkboxes for six Asian ethnicities — Chinese, Filipino, Asian Indian, Vietnamese, Korean, and Japanese — along with a seventh “Other Asian” category accompanied by a fill-in text area.
The 2021 American Community Survey provides the latest available demographic data on Asian Americans, with wo datasets for each ethnicity: one that includes multiracial people and another that excludes them. This article includes those who identify as an Asian ethnicity in combination with others. It also lists Taiwanese Americans separately from Chinese Americans.
Learn more about US demographics, Pacific Islander Demographics, the jobs with the most Asian Americans, and get the facts every week by signing up for our newsletter.SOURCES & FOOTNOTESCensus BureauAmerican Community Survey 1-Year Estimates (2021)Office of Management and BudgetRevisions to the Standards for the Classification of Federal Data on Race and Ethnicity
Explore more of USAFacts
RELATED ARTICLES
View AllAAPI Demographics: Data on Pacific Islander ethnicities, education, and incomeWhich jobs have the highest representation of Asian Americans?
RELATED DATA
View AllPopulation333.29 million2022
NEWSLETTER
Data delivered to your inbox
Keep up with the latest data and most popular content.
Our nation, in numbers
Government data from over 70 sources organized to show how the money flows, the impact, and who “the people” are.AgricultureChild & Social ServicesClimateConsumer & Employee SafeguardsCOVID-19Crime & JusticeDefense & MilitaryDisasters & Emergency ReliefEconomyEducationEnergyEnvironment & Natural ResourcesForeign AffairsGovernmentHealthImmigration & Border SecurityOur Changing PopulationSocial Security & MedicareStandard of LivingTransportation & InfrastructureVeteransWealth & SavingsVisualizationsArticlesAnnual PublicationsAbout USAFactsFAQData SourcesPrinciplesPress Releases
© 2023 USAFacts. All rights reserved.Contact UsPrivacy PolicyTerms of Service
TOPICSDATAREPORTSGOVERNMENT 10-KCLIMATE
AAPI Demographics: Data on Asian American ethnicities, geography, income, and education
From Indian Americans to Laotian Americans, demographics across Asian ethnicities reveal differences in everything from educational attainment to family size.
Published on Mon, May 17, 2021 9:53AM PDT | Updated Mon, May 1, 2023 4:04PM PDT
There are 23.5 million Asian Americans living in the US, making up 7.1% of the US population. Among them, 3.8 million identify as Asian in combination with another race.
Asian Americans are sometimes grouped with Pacific Islanders under the “AAPI” umbrella, and the joint Asian American and Pacific Islander heritage month is celebrated annually in May. The AAPI population is the fastest growing racial group in the US, with a population that increased 27% from 2011 to 2021.
The demographics of Asian Americans vary drastically across ethnic groups. Taiwanese and Indian Americans have the highest educational and income outcomes, while Southeast Asian Americans have lower incomes and educational attainment.
Which are the largest Asian American ethnic groups in the United States?
Six Asian ethnicities have a US population exceeding 1 million. With 5.3 million people, Chinese Americans are the largest group, representing 22% of the Asian American population. The next largest groups are Indian Americans (20% of all Asian Americans), Filipino Americans (16%), Vietnamese Americans (10%), Korean Americans (8%), and Japanese Americans (7%).
Which states have the highest Asian American populations?
Three states account for 46% of the Asian American population: California, New York, and Texas. The states with the largest share of Asian Americans are Hawaii (57%), California (18%), and Washington (12%).
Over half of Hawaiians identify as Asian-American.
Percentage of each state that identifies as Asian, 20211.256.5Figures include those that identify as Asian alone or in combination with another race.Source: US Census BureauGet the dataDownload imageDownload SVGEMBED ON YOUR WEBSITECopy
How do Asian Americans’ education levels and income differ by ethnicity?
Fifty-five percent of Asian Americans over age 25 have a bachelor’s degree, compared with 35% of the total population. About 80% of Taiwanese Americans have a bachelor’s, the highest of any Asian ethnicity. At 76%, Indian Americans make up the next highest percentage. Laotian Americans have the lowest educational attainment among Asian ethnicities.
The median household income for Asian American households is $97,626 a year, 40% higher than the US median of $69,717. Two Asian American ethnic groups have median household income above $100,000: the median for Indian American households is $138,418, and the median for Taiwanese American households is $117,652.
Indian Americans bring in twice the income of the average American.
Median household income by Asian ethnicity, 2021Indian$138,418Taiwanese$117,652Filipino$96,883Pakistani$95,747Sri Lankan$94,034Chinese$91,881Japanese$90,566Indonesian$86,751Korean$83,354Hmong$80,175Vietnamese$78,845Thai$78,434Nepalese$78,043Laotian$76,962Cambodian$75,424Bangladeshi$66,641Burmese$62,352Figures include those that identify as one ethnicity in combination with another.Source: US Census BureauGet the dataDownload imageDownload SVGEMBED ON YOUR WEBSITECopy
How do Asian-American family structures differ by ethnicity?
Asian-Americans tend to be more family-based than the average US household. Seventy-one percent of Asian households are made up of families — instead of people living alone or with unrelated people — compared with 65% of all households.
With an average of 3.4 people, Asian American families are also larger than the average of all US families at 3.2.
The average Hmong, Burmese, Pakistani, or Bangladeshi American family in the US all have more than four members. Korean and Japanese American families are the smallest among all groups, with an average size of 3.1.
Among Asian ethnicities, Hmong American families tend to be the largest.
Average family size by Asian ethnicity, 2021Hmong4.65Burmese4.28Bangladeshi4.1Pakistani4.09Cambodian3.85Laotian3.65Nepalese3.64Vietnamese3.57Filipino3.52Any Asian American3.4Asian Indian3.35Sri Lankan3.35Chinese (except Taiwanese)3.21Thai3.16Overall population3.15Indonesian3.15Taiwanese3.1Japanese3.05Korean3.05Figures include those that identify as Asian in combination with another racial group.Source: Census Bureau Get the dataDownload imageDownload SVGEMBED ON YOUR WEBSITECopy
How does the government define Asian American, and where does the data come from?
In 1997, the Office of Management and Budget (OMB) outlined the current standards for federal data on race and ethnicity that separated the “Asian or Pacific Islander” category into “Asian” and “Native Hawaiian or Other Pacific Islander.”
The Census Bureau, in accordance with this, defines an Asian person as “a person having origins in any of the original peoples of the Far East, Southeast Asia, or the Indian subcontinent including, for example, Cambodia, China, India, Japan, Korea, Malaysia, Pakistan, the Philippine Islands, Thailand, and Vietnam.”A sample Census form
The agency has never had a checkbox for “Asian” or “Asian American” in its official census forms. In the 2020 census form, there were checkboxes for six Asian ethnicities — Chinese, Filipino, Asian Indian, Vietnamese, Korean, and Japanese — along with a seventh “Other Asian” category accompanied by a fill-in text area.
The 2021 American Community Survey provides the latest available demographic data on Asian Americans, with wo datasets for each ethnicity: one that includes multiracial people and another that excludes them. This article includes those who identify as an Asian ethnicity in combination with others. It also lists Taiwanese Americans separately from Chinese Americans.
Learn more about US demographics, Pacific Islander Demographics, the jobs with the most Asian Americans, and get the facts every week by signing up for our newsletter.SOURCES & FOOTNOTESCensus BureauAmerican Community Survey 1-Year Estimates (2021)Office of Management and BudgetRevisions to the Standards for the Classification of Federal Data on Race and Ethnicity
Explore more of USAFacts
RELATED ARTICLES
View AllAAPI Demographics: Data on Pacific Islander ethnicities, education, and incomeWhich jobs have the highest representation of Asian Americans?
RELATED DATA
View AllPopulation333.29 million2022
NEWSLETTER
Data delivered to your inbox
Keep up with the latest data and most popular content.
Our nation, in numbers
Government data from over 70 sources organized to show how the money flows, the impact, and who “the people” are.AgricultureChild & Social ServicesClimateConsumer & Employee SafeguardsCOVID-19Crime & JusticeDefense & MilitaryDisasters & Emergency ReliefEconomyEducationEnergyEnvironment & Natural ResourcesForeign AffairsGovernmentHealthImmigration & Border SecurityOur Changing PopulationSocial Security & MedicareStandard of LivingTransportation & InfrastructureVeteransWealth & SavingsVisualizationsArticlesAnnual PublicationsAbout USAFactsFAQData SourcesPrinciplesPress Releases
© 2023 USAFacts. All rights reserved.Contact UsPrivacy PolicyTerms of Service